
Mastering electrocardiogram (ECG) interpretation stands as one of the most crucial skills you’ll develop during your medical journey. Whether you’re a medical student preparing for exams, a resident handling emergency cases, or a practitioner refreshing your diagnostic abilities, understanding how to read ECGs systematically can literally save lives. This comprehensive guide walks you through ECG interpretation: stepwise guide for undergraduates with practical examples, normal values, common pitfalls, and exam-focused tips tailored specifically for MBBS students and doctors.
What is ECG Interpretation?
ECG interpretation: stepwise guide for undergraduates refers to the systematic process of analyzing the electrical activity of the heart recorded through electrodes placed on the body’s surface. An electrocardiogram captures the heart’s depolarization and repolarization patterns, displayed as distinctive waves and complexes on graph paper.
According to Harrison’s Principles of Internal Medicine and other standard medical textbooks followed worldwide, ECG interpretation involves evaluating specific components—P waves, QRS complexes, ST segments, and T waves—to identify normal cardiac function or detect abnormalities ranging from arrhythmias to acute myocardial infarction.
The 12-lead ECG provides a comprehensive view of the heart’s electrical activity from multiple angles, using 10 electrodes to generate 12 different perspectives. This multi-dimensional approach allows clinicians to localize cardiac pathology with remarkable precision.
Why ECG Interpretation Matters for Medical Students and Doctors
Understanding ECG reading for medical students carries profound clinical significance. Studies reveal that accurate ECG interpretation directly correlates with improved patient outcomes, including shorter hospital stays and reduced readmission rates. For MBBS students specifically, ECG interpretation skills serve multiple critical purposes:
- Academic Excellence: ECG questions frequently appear in university examinations, competitive exams like NEET-PG, USMLE, and practical assessments. Medical students who master systematic ECG interpretation demonstrate superior diagnostic competencies early in their careers.
- Clinical Competence: Emergency departments, intensive care units, and cardiology wards require rapid, accurate ECG interpretation. The ability to identify life-threatening conditions like ST-elevation myocardial infarction (STEMI), ventricular tachycardia, or complete heart block can mean the difference between life and death.
- Professional Confidence: Research indicates that medical students often lack confidence in ECG interpretation despite its fundamental importance. Systematic training significantly improves both competency and confidence levels.
- Career Advancement: Whether pursuing internal medicine, emergency medicine, or general practice, strong ECG interpretation skills enhance your clinical decision-making and professional reputation.
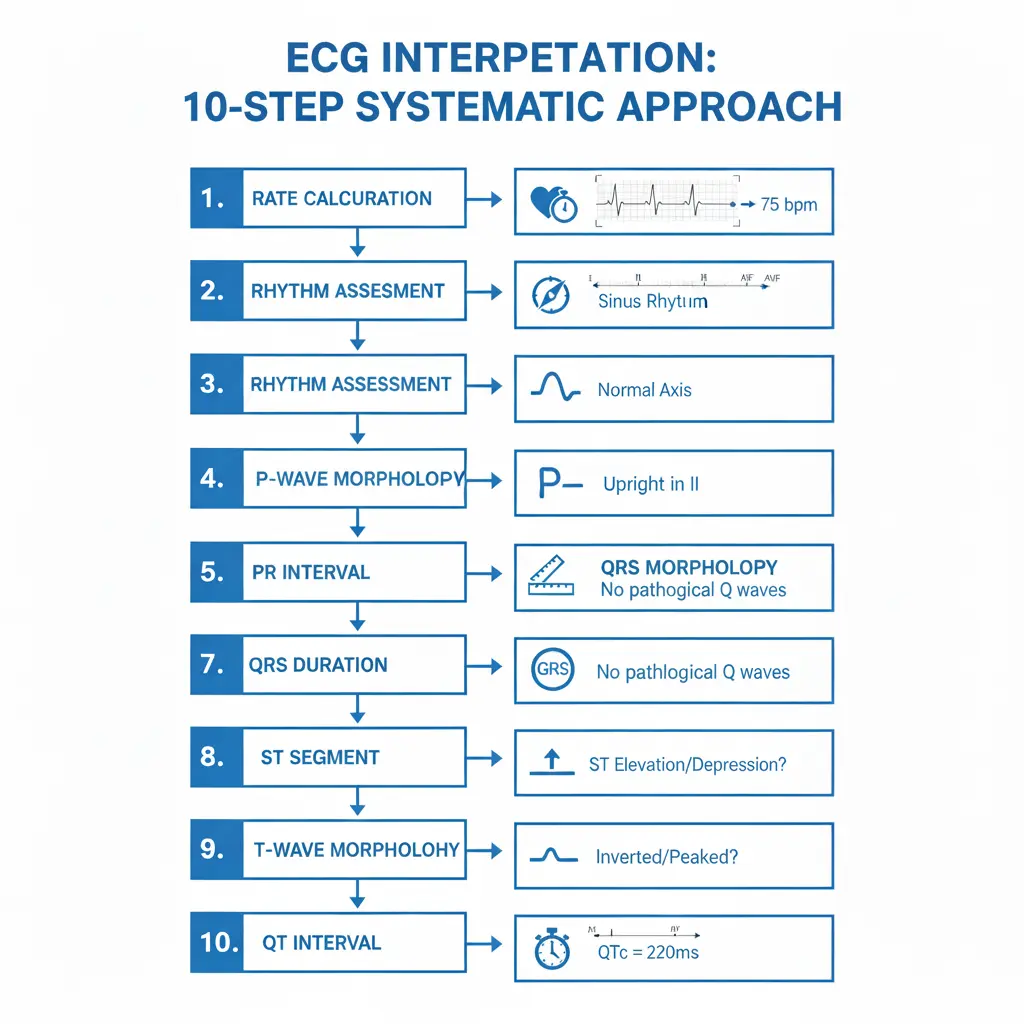
The 10-Step Systematic Approach to ECG Interpretation
The cornerstone of mastering ECG interpretation: stepwise guide for undergraduates lies in developing a consistent, systematic approach. This method ensures you never miss critical findings and builds pattern recognition over time.
Step 1: Verify Patient Information and ECG Quality
Before analyzing any ECG, confirm the patient’s name, date of birth, and the date and time the ECG was recorded. This seemingly basic step prevents interpretation errors and allows comparison with previous ECGs.
Check the calibration: standard settings are 25 mm/second paper speed and 10 mm/millivolt amplitude. If these settings differ, the ECG appearance changes dramatically, potentially leading to misdiagnosis.
Assess the ECG quality by checking for artifacts caused by patient movement, muscle tremors, or electrical interference. Poor electrode contact or incorrect placement can produce false abnormalities.
Step 2: Calculate Heart Rate
The heart rate determines whether the patient has bradycardia (less than 60 beats per minute), normal rate (60-100 bpm), or tachycardia (greater than 100 bpm).
For Regular Rhythms: Use the 300 method—count the number of large squares between two consecutive R waves and divide 300 by this number. The sequence goes: 300, 150, 100, 75, 60, 50, 43, 37.
For Irregular Rhythms: Count the number of QRS complexes in a 10-second strip (usually marked on ECG paper) and multiply by 6 to get beats per minute.
Example: If there are 4 large squares between R waves, the heart rate is 300 ÷ 4 = 75 bpm (normal range).
Step 3: Assess Cardiac Rhythm
Determining rhythm regularity requires systematic evaluation:
Check P Wave Presence: Normal sinus rhythm shows upright P waves in leads I, II, and aVF, with one P wave preceding each QRS complex.
Evaluate Rhythm Regularity: Measure R-R intervals across the strip. Equal distances indicate regular rhythm; varying distances suggest irregular rhythm.
Identify Rhythm Patterns:
- Regular rhythm with normal P waves = Sinus rhythm
- Irregularly irregular with absent P waves = Atrial fibrillation (AF)
- Regular rhythm with sawtooth baseline = Atrial flutter
- No P waves with regular narrow QRS = Junctional rhythm
Step 4: Determine Cardiac Axis
The cardiac axis represents the overall direction of electrical depolarization through the ventricles. While this may seem complex initially, a simple method uses only leads I and aVF:
Quadrant Method (Quick Assessment):
- Lead I positive + aVF positive = Normal axis (-30° to +90°)
- Lead I positive + aVF negative = Left axis deviation
- Lead I negative + aVF positive = Right axis deviation
- Lead I negative + aVF negative = Extreme axis deviation
Clinical Significance:
- Left axis deviation suggests left ventricular hypertrophy, left anterior fascicular block, or inferior myocardial infarction
- Right axis deviation may indicate right ventricular hypertrophy, left posterior fascicular block, or pulmonary embolism
Step 5: Measure PR Interval
The PR interval, measured from the beginning of the P wave to the start of the QRS complex, reflects the time taken for electrical impulses to travel from the atria through the AV node to the ventricles.
Normal Range: 0.12 to 0.20 seconds (3-5 small squares).
Abnormal Findings:
- Prolonged PR interval (>0.20 seconds) indicates first-degree AV block, caused by delayed conduction through the AV node due to ischemia, medication effects (beta-blockers, calcium channel blockers), or degenerative changes
- Short PR interval (<0.12 seconds) suggests pre-excitation syndromes like Wolff-Parkinson-White (WPW), where accessory pathways bypass the AV node, creating a delta wave
- Real-world application: In emergency settings, recognizing AV blocks helps determine if the patient requires immediate pacing or medication adjustment.
Step 6: Analyze QRS Complex
The QRS complex represents ventricular depolarization and provides crucial diagnostic information.
Normal QRS Duration: Less than 0.12 seconds (less than 3 small squares).
QRS Morphology Assessment:
- Narrow QRS (<0.12s): Indicates supraventricular origin (atrial or junctional)
- Wide QRS (≥0.12s): Suggests ventricular origin, bundle branch block, or ventricular pre-excitation
- Bundle Branch Blocks—remember the “WiLLiaM MaRRoW” mnemonic:
Right Bundle Branch Block (RBBB):
- QRS duration ≥120 ms
- RSR’ pattern (“M-shaped”) in V1-V3
- Wide, slurred S wave in lateral leads (I, aVL, V5-V6)
- MaRRoW: V1 looks like “M”, V6 looks like “W”
Left Bundle Branch Block (LBBB):
- QRS duration ≥120 ms
- Broad, notched R wave in V5-V6, I, aVL
- Deep, wide S wave in V1-V2
- WiLLiaM: V1 looks like “W”, V6 looks like “M”
Clinical pearl: LBBB can mask myocardial infarction on ECG, requiring modified Sgarbossa criteria for STEMI diagnosis.
Step 7: Evaluate ST Segments
ST segment analysis is critical for identifying myocardial ischemia and infarction.
Normal ST Segment: Should be isoelectric (at the same level as the PR segment), though slight elevation (<1mm) in precordial leads V2-V3 can be normal.
ST Elevation (≥1mm in two contiguous leads):
- Limb leads: ≥1mm elevation suggests STEMI
- V2-V3 in men <40 years: ≥2.5mm
- V2-V3 in men ≥40 years: ≥2mm
- V2-V3 in women: ≥1.5mm
STEMI Localization by Lead Groups:
- Anterior STEMI: V1-V4 (Left Anterior Descending artery occlusion)
- Inferior STEMI: II, III, aVF (Right Coronary Artery or Left Circumflex)
- Lateral STEMI: I, aVL, V5-V6 (Left Circumflex artery)
- Posterior STEMI: ST depression in V1-V3 with tall R waves
ST Depression: Suggests subendocardial ischemia, reciprocal changes from STEMI elsewhere, or digoxin effect.
Step 8: Review T Waves
T waves represent ventricular repolarization and show various patterns in different conditions.
Normal T Waves: Asymmetric, upright in most leads except aVR, with amplitude less than 5mm in limb leads and 10mm in precordial leads.
T Wave Abnormalities:
- Inverted T waves: May indicate ischemia, infarction, bundle branch block, or ventricular hypertrophy with strain pattern
- Tall, peaked T waves: Classic sign of hyperkalemia; symmetrical, narrow-based, and prominent
- Flattened T waves: Associated with hypokalemia, often accompanied by prominent U waves
- Electrolyte disorders significantly impact ECG findings, making T wave analysis essential in patients with renal dysfunction or electrolyte imbalances.
Step 9: Calculate QT Interval
The QT interval measures the time from ventricular depolarization to complete repolarization.
Normal QT Interval: 0.35 to 0.43 seconds, but varies with heart rate. Use corrected QT (QTc) calculated by Bazett’s formula: QTc = QT / √RR interval.
Normal QTc:
-
Men: <0.44 seconds
-
Women: <0.46 seconds
Clinical Significance:
-
Prolonged QT: Risk of torsades de pointes (polymorphic ventricular tachycardia); caused by medications, hypokalemia, hypocalcemia, or congenital long QT syndrome
-
Shortened QT: Seen in hypercalcemia, digoxin toxicity, or hereditary short QT syndrome
Quick tip: The QT interval should be less than half the R-R interval at normal heart rates.
Step 10: Identify Additional Findings
Look for less common but clinically significant features:
- U Waves: Small deflections following T waves, prominent in hypokalemia (potassium <3.0 mEq/L).
- Delta Waves: Slurred upstroke of QRS complex in Wolff-Parkinson-White syndrome, indicating ventricular pre-excitation.
- Q Waves: Pathological Q waves (≥0.04 seconds duration or ≥25% of R wave height) suggest prior myocardial infarction.
Understanding 12-Lead ECG: Electrode Placement and Lead Configuration
Proper electrode placement is fundamental to obtaining accurate ECG recordings. The 12-lead ECG uses 10 electrodes to generate 12 different views of the heart’s electrical activity.
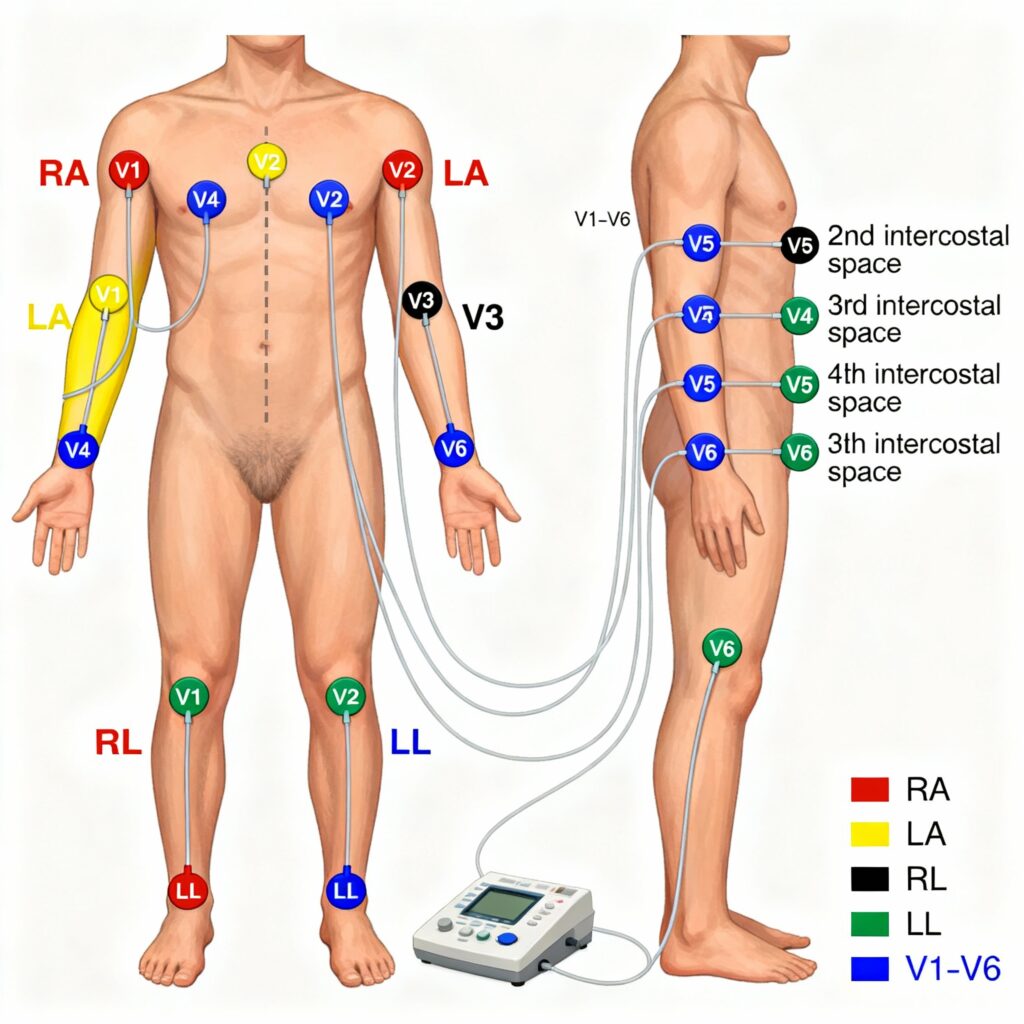
Limb Lead Placement
Standard Limb Electrodes:
- RA (Right Arm): Anywhere between right shoulder and right elbow
- LA (Left Arm): Anywhere between left shoulder and left elbow
- RL (Right Leg): Below right torso, above right ankle (ground electrode)
- LL (Left Leg): Below left torso, above left ankle
These four electrodes create six limb leads:
- Bipolar leads: I, II, III (measure voltage difference between two electrodes)
- Augmented unipolar leads: aVR, aVL, aVF (measure voltage at one electrode relative to others)
Precordial (Chest) Lead Placement
Six Precordial Electrodes:
- V1: 4th intercostal space, right sternal margin
- V2: 4th intercostal space, left sternal margin
- V3: Midway between V2 and V4
- V4: 5th intercostal space, midclavicular line (at the apex)
- V5: 5th intercostal space, anterior axillary line (same level as V4)
- V6: 5th intercostal space, midaxillary line (same level as V4 and V5)
- Important tip for female patients: Place leads V3-V6 under the left breast, not on it.
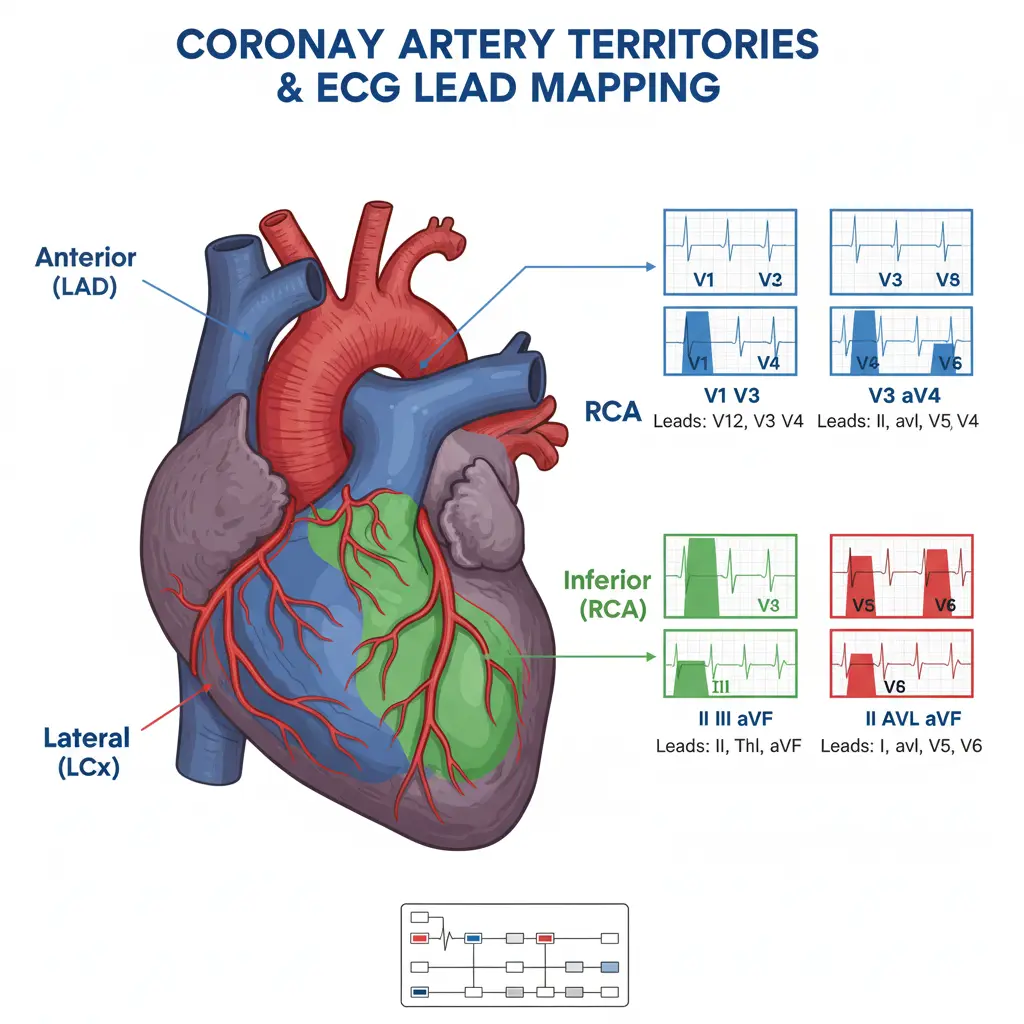
Anatomical Correlation: Which Leads View Which Areas?
Understanding lead-territory relationships helps localize cardiac pathology:
| Cardiac Territory | ECG Leads | Coronary Artery |
|---|---|---|
| Inferior wall | II, III, aVF | Right Coronary Artery (RCA) |
| Anterior wall | V1-V4 | Left Anterior Descending (LAD) |
| Lateral wall | I, aVL, V5-V6 | Left Circumflex (LCx) |
| Septal region | V1-V2 | LAD septal branches |
| Posterior wall | V7-V9 (or reciprocal V1-V3) | RCA or LCx |
This anatomical knowledge proves invaluable when interpreting STEMIs, allowing you to predict which coronary artery is occluded and anticipate potential complications.
Common ECG Abnormalities Every Medical Student Must Recognize
Mastering ECG abnormalities identification requires familiarity with patterns you’ll encounter frequently in clinical practice and examinations.
Life-Threatening Arrhythmias
Ventricular Tachycardia (VT):
- Wide QRS complexes (>120 ms)
- Regular rhythm
- Heart rate >100 bpm
- May be pulseless (requires immediate defibrillation) or stable (requires urgent cardioversion)
Clinical scenario: A 65-year-old with history of myocardial infarction presents unconscious. ECG shows regular, wide complex tachycardia at 180 bpm. This is VT until proven otherwise—initiate ACLS protocol immediately.
Ventricular Fibrillation (VF):
- Chaotic, irregular waveforms
- No identifiable QRS complexes
- Cardiac arrest rhythm requiring immediate CPR and defibrillation
Complete (Third-Degree) Heart Block:
- Complete AV dissociation
- P waves and QRS complexes march independently
- Often requires temporary or permanent pacemaker
Atrial Arrhythmias
Atrial Fibrillation (AF):
- Irregularly irregular rhythm
- Absent P waves
- Narrow QRS complexes (unless aberrant conduction)
- Fibrillatory baseline between QRS complexes
AF is the most commonly encountered arrhythmia in clinical practice, affecting millions worldwide and increasing stroke risk five-fold.
Atrial Flutter:
- Regular or irregular rhythm
- Sawtooth flutter waves (F waves)
- Typically 2:1, 3:1, or 4:1 AV conduction ratio
- Atrial rate ~300 bpm, ventricular rate varies
Conduction Abnormalities
First-Degree AV Block:
- PR interval >0.20 seconds
- Every P wave followed by QRS
- Usually benign but monitor for progression
Second-Degree AV Block:
- Mobitz Type I (Wenckebach): Progressive PR prolongation until QRS dropped; relatively benign
- Mobitz Type II: Fixed PR interval with intermittent dropped QRS; high risk of complete block, may need pacemaker
Myocardial Infarction Patterns
Acute STEMI is the most critical ECG diagnosis you’ll make:
- ST elevation in contiguous leads
- Reciprocal ST depression
- T wave inversion (evolves over hours to days)
- Development of pathological Q waves (days to weeks)
Evolution of MI on ECG:
- Hyperacute phase (minutes to hours): Tall, peaked T waves
- Acute phase (hours to days): ST elevation, T wave inversion begins
- Subacute phase (days to weeks): Q waves develop, ST elevation resolves
- Chronic phase (weeks to months): Persistent Q waves, normalized ST/T
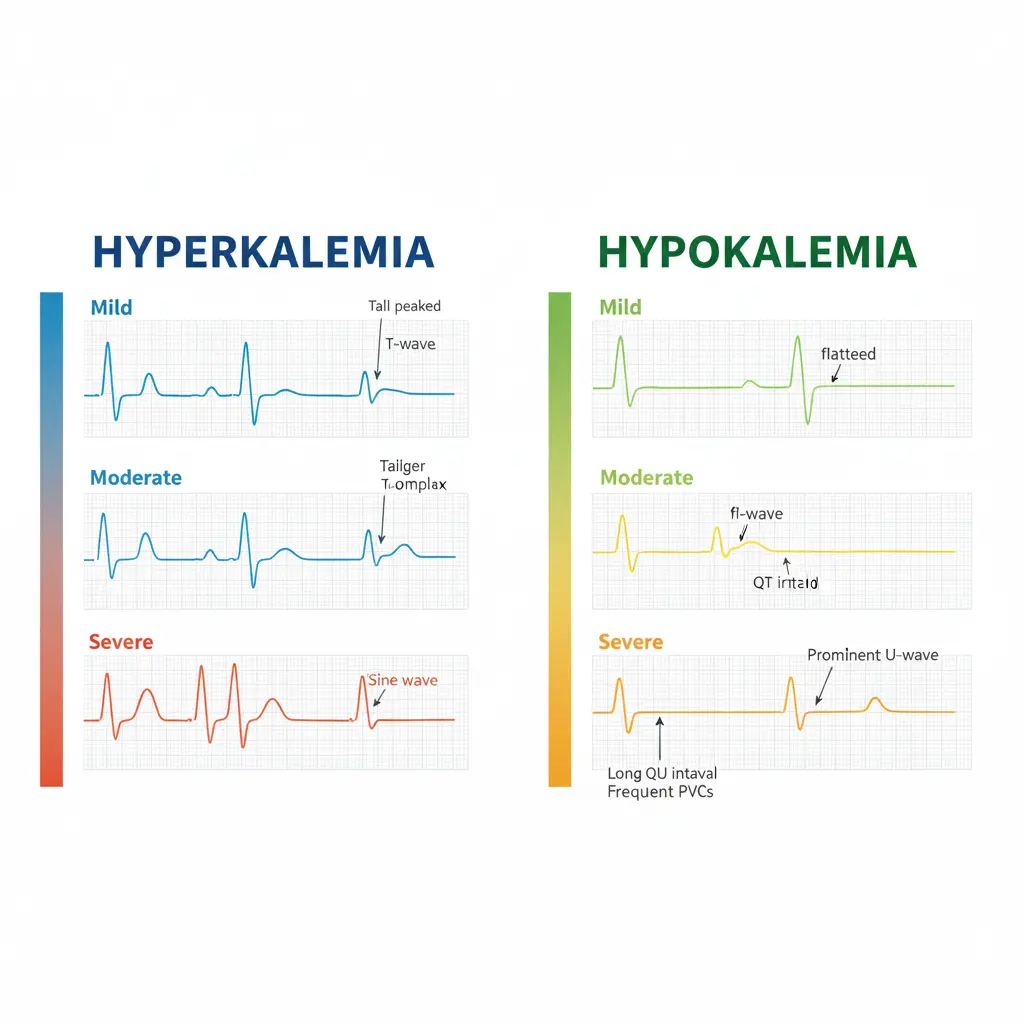
Electrolyte Abnormalities
Hyperkalemia (High Potassium):
- Mild (5.5-6.5 mEq/L): Tall, peaked T waves with narrow base
- Moderate (6.5-7.5 mEq/L): Prolonged PR interval, flattened P waves
- Severe (>7.5 mEq/L): Wide QRS, sine wave pattern, cardiac arrest risk
Hypokalemia (Low Potassium):
- Flattened or inverted T waves
- Prominent U waves (hallmark finding)
- ST segment depression
- Prolonged QU interval (often mistaken for prolonged QT)
- Increased risk of arrhythmias including torsades de pointes
Hypercalcemia (High Calcium):
- Shortened QT interval
- Shortened ST segment
- Increased risk of ventricular arrhythmias
Hypocalcemia (Low Calcium):
- Prolonged QT interval
- Prolonged ST segment (T wave remains normal)
Ventricular Hypertrophy
Left Ventricular Hypertrophy (LVH):
Most commonly used criteria (Sokolov-Lyon):
- S wave in V1 + R wave in V5 or V6 >35 mm
- OR R wave in aVL >11 mm
Additional LVH features:
- Left axis deviation
- Prolonged QRS duration
- ST depression and T wave inversion in lateral leads (strain pattern)
- Increased QRS voltage
Right Ventricular Hypertrophy (RVH):
- Right axis deviation
- Tall R wave in V1 (R/S ratio >1)
- Deep S wave in V5-V6
- ST depression in right precordial leads
Common Mistakes in ECG Interpretation and How to Avoid Them
Even experienced clinicians make ECG interpretation errors. Being aware of these pitfalls helps you avoid them.
Mistake 1: Skipping Systematic Approach
The Problem: Jumping to pattern recognition without systematic analysis leads to missed findings. You might spot obvious ST elevation but miss concurrent AV block or electrolyte abnormalities.
The Solution: Always use the same 10-step approach for every ECG, regardless of how obvious one finding appears. Discipline in methodology prevents diagnostic errors.
Mistake 2: Misidentifying Artifacts as Arrhythmias
The Problem: Patient movement, poor electrode contact, or electrical interference can mimic atrial fibrillation or ventricular arrhythmias.
The Solution: Before diagnosing any arrhythmia, check ECG quality across all leads. True cardiac rhythms should be consistent across multiple leads. When in doubt, repeat the ECG with proper patient positioning and electrode placement.
Mistake 3: Over-Reliance on Automated Interpretation
The Problem: ECG machines provide automated interpretations, but studies show error rates of 10-20%, particularly for complex rhythms and artifact-laden tracings.
The Solution: Use automated readings as a preliminary guide only. Always perform manual interpretation, especially for abnormal findings. Never trust machine interpretation alone when making clinical decisions.
Mistake 4: Ignoring Clinical Context
The Problem: Interpreting ECGs without considering patient symptoms, history, and physical examination leads to inappropriate management.
The Solution: Always correlate ECG findings with clinical presentation. For example, ST elevation in a patient with typical angina requires immediate catheterization, while the same ECG in an asymptomatic young athlete might represent benign early repolarization.
Mistake 5: Misidentifying Normal Variants as Pathology
The Problem: Many normal variants (early repolarization, incomplete RBBB, sinus arrhythmia) can be mistaken for disease states.
The Solution: Familiarize yourself with common normal variants. Early repolarization shows ST elevation with characteristic upward concavity, unlike the convex ST elevation of STEMI. Athletic hearts often display sinus bradycardia and voltage criteria for LVH without actual hypertrophy.
Mistake 6: Incorrect Lead Placement
The Problem: Misplaced electrodes, particularly precordial leads, can mimic or mask myocardial infarction, producing false ECG abnormalities.
The Solution: Verify proper electrode placement, especially in emergency situations. Anatomical landmarks (sternal angle for 2nd rib, counting ribs, identifying midclavicular line) ensure consistency.
Mistake 7: Missing Subtle STEMI Patterns
The Problem: Not all STEMIs present with dramatic ST elevation. Posterior MI shows ST depression in V1-V3, while some anterior STEMIs show only subtle changes initially.
The Solution: Look for reciprocal changes, compare with previous ECGs when available, and maintain high clinical suspicion in patients with typical symptoms even if ECG changes are subtle.
How ECG Interpretation Works: Understanding the Pathophysiology
Grasping the underlying pathophysiology enhances your interpretive skills and helps you understand why certain patterns appear.
Cardiac Electrical Conduction System
The heart’s electrical activity follows a precise sequence:
- Sinoatrial (SA) Node: The heart’s natural pacemaker, located in the right atrium, fires at 60-100 bpm under normal conditions
- Atrial Depolarization: Electrical impulse spreads through both atria, creating the P wave on ECG
- AV Node Delay: The impulse slows at the AV node (allowing ventricular filling), represented by the PR segment
- Bundle of His and Bundle Branches: Rapid conduction through specialized pathways
- Purkinje Fibers: Deliver impulse to ventricular myocardium, causing the QRS complex
- Ventricular Repolarization: Recovery phase produces the T wave
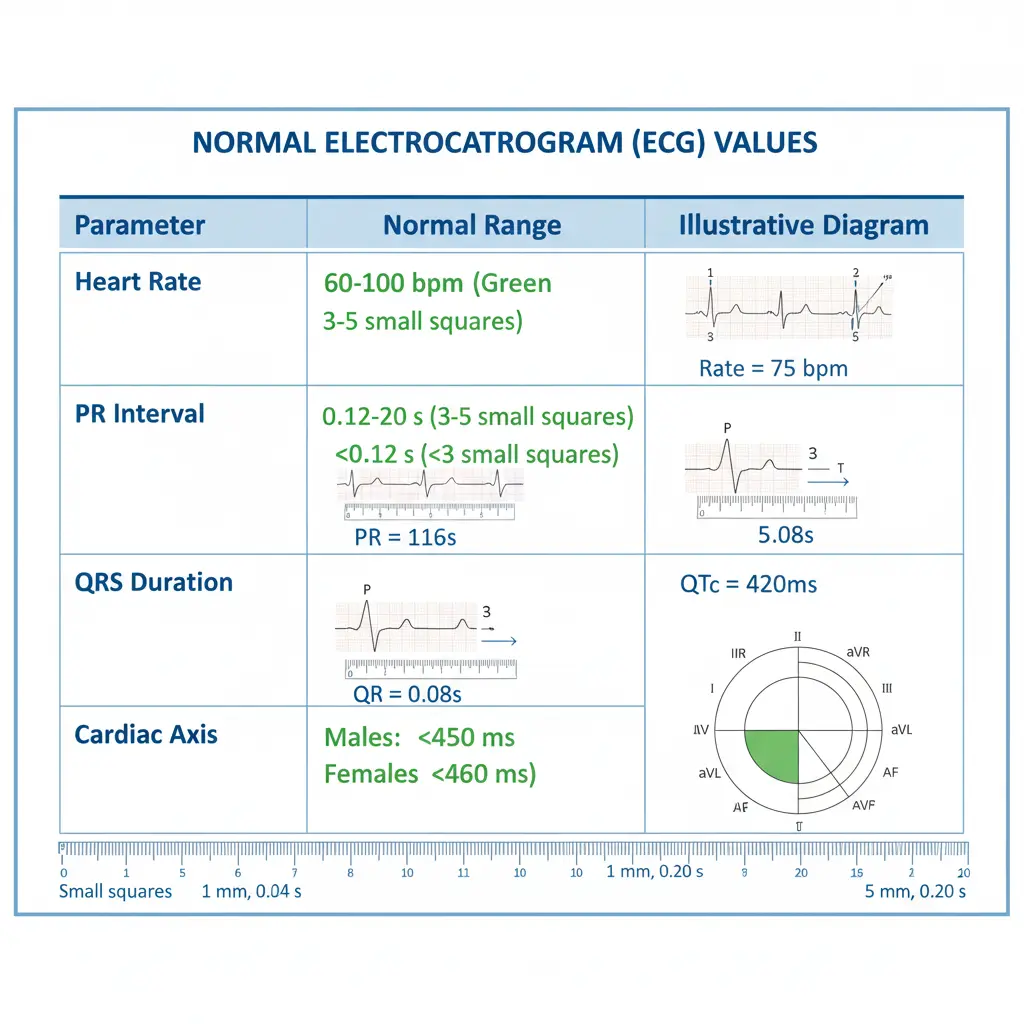
ECG Paper and Measurements
Understanding ECG paper is fundamental:
Horizontal Axis (Time):
- Each small square = 0.04 seconds (40 milliseconds)
- Each large square (5 small squares) = 0.20 seconds (200 milliseconds)
Vertical Axis (Voltage):
- Each small square = 0.1 millivolts (1 mm)
- Each large square = 0.5 millivolts (5 mm)
Standard Calibration: 10 mm = 1 millivolt at paper speed of 25 mm/second.
Why Different Conditions Produce Specific Patterns
Bundle Branch Blocks: When one bundle branch fails to conduct, the opposite ventricle depolarizes first, then the impulse travels through myocardium (slower than specialized conduction tissue) to depolarize the affected ventricle. This produces wide QRS complexes with characteristic morphology.
Myocardial Infarction: When coronary artery occlusion causes transmural ischemia, injured myocytes cannot maintain normal electrical potential. This creates a “current of injury” flowing from damaged to healthy tissue, manifesting as ST elevation on the ECG surface.
Electrolyte Disturbances: Potassium directly affects cardiac action potentials. Hyperkalemia accelerates repolarization (peaked T waves) and slows conduction (wide QRS), while hypokalemia prolongs repolarization (prominent U waves, long QT).
Expert Insights and Data-Driven Points
Research consistently demonstrates the importance of structured ECG education for medical students.
- Study Finding: A 2024 study published in Frontiers in Medicine revealed that medical students who underwent targeted ECG training improved their diagnostic accuracy from 45% to 78% over six months. Importantly, cardiology consultants maintained accuracy above 90%, highlighting the value of continued practice and clinical exposure.
- Educational Gap: Research from King Faisal University showed that medical students struggled most with interpreting left bundle branch block (33.4% correct), long QT (21.2% correct), and pacemaker rhythms (19.8% correct). This data identifies specific areas requiring enhanced teaching focus.
- Gender and Age Factors: Eye-tracking studies found that younger clinicians (26-30 years) outperformed older groups in ECG interpretation, while prolonged engagement with complex ECG segments indicated interpretative challenges. These findings suggest the importance of early, intensive training.
- Clinical Impact: Studies correlating ECG skills with patient outcomes demonstrate that healthcare providers with superior ECG interpretation abilities reported better patient outcomes, including shorter hospital stays and reduced readmission rates. This underscores the real-world significance of mastering these skills.
- Technology Integration: Research indicates that collaborative learning improves ECG interpretation accuracy and speed compared to independent study, suggesting the value of group learning sessions and peer discussions.
Real-World ECG Interpretation: Clinical Case Examples
Case 1: The 28-Year-Old with Palpitations
Presentation: A 28-year-old woman presents to the emergency department with sudden-onset palpitations lasting 2 hours. She feels her heart “racing” but denies chest pain or shortness of breath.
ECG Findings:
- Heart rate: 180 bpm
- Regular rhythm
- Narrow QRS complexes (<120 ms)
- No visible P waves
- Abrupt onset (per patient history)
Interpretation: Supraventricular tachycardia (SVT), most likely AV nodal reentrant tachycardia (AVNRT).
Management: Vagal maneuvers (Valsalva, carotid massage), followed by adenosine if unsuccessful. Patient converted to sinus rhythm after Valsalva maneuver.
Learning Point: Regular narrow-complex tachycardia without visible P waves suggests SVT. Always try vagal maneuvers first before pharmacological intervention.
Case 2: The 65-Year-Old with Chest Pain
Presentation: A 65-year-old man with diabetes and hypertension develops severe chest pain radiating to his left arm. Pain started 30 minutes ago.
- ECG Findings:
- Heart rate: 90 bpm
- Regular sinus rhythm
- ST elevation of 3mm in leads II, III, and aVF
- Reciprocal ST depression in leads I and aVL
- Normal QRS duration
Interpretation: Acute inferior STEMI, likely due to right coronary artery occlusion.
Management: Immediate activation of cardiac catheterization lab for primary percutaneous coronary intervention (PCI). Patient received aspirin, clopidogrel, and heparin. Door-to-balloon time: 65 minutes.
Learning Point: Time is muscle. Recognizing STEMI patterns and understanding localization guides immediate treatment decisions. Always look for reciprocal changes to confirm diagnosis.
Case 3: The Confused Dialysis Patient
Presentation: A 72-year-old woman on hemodialysis presents confused. She missed her last two dialysis sessions.
ECG Findings:
- Heart rate: 55 bpm
- Regular rhythm with occasional wide QRS complexes
- Tall, peaked T waves with narrow base in all leads
- PR interval prolonged (240 ms)
- Absent P waves in some complexes
Interpretation: Severe hyperkalemia with life-threatening features.
Laboratory: Potassium = 8.2 mEq/L (critical).
Management: Immediate IV calcium gluconate (cardiac membrane stabilization), insulin with dextrose, nebulized albuterol, and emergency hemodialysis. ECG normalized after dialysis.
Learning Point: Peaked T waves should immediately trigger consideration of hyperkalemia, especially in renal failure patients. This is a medical emergency requiring immediate treatment.
Comparison: ECG Interpretation vs Other Cardiac Diagnostic Methods
Understanding how ECG compares to other diagnostic modalities helps you appreciate its strengths and limitations.
| Diagnostic Method | Advantages | Limitations | Best Use Cases |
|---|---|---|---|
| ECG | Rapid, inexpensive, widely available, non-invasive, excellent for rhythm and ischemia assessment | Limited structural information, operator-dependent interpretation, artifacts common | Arrhythmias, acute MI, conduction disorders, screening |
| Echocardiography | Excellent structural detail, valve function, ejection fraction measurement | More expensive, requires skilled operator, limited availability | Valvular disease, cardiomyopathy, ejection fraction assessment |
| Cardiac CT | Detailed coronary anatomy, calcium scoring | Radiation exposure, contrast needed, expensive | Coronary artery disease assessment, structural abnormalities |
| Cardiac MRI | Gold standard for myocardial tissue characterization | Very expensive, time-consuming, limited availability | Cardiomyopathy characterization, myocarditis, tumors |
| Holter Monitoring | 24-48 hour continuous rhythm monitoring | Delayed analysis, cannot capture intermittent symptoms lasting >48h | Paroxysmal arrhythmias, symptom-rhythm correlation |
Common Pitfalls Medical Students Should Avoid
Beyond interpretation errors, several behavioral and knowledge gaps commonly affect medical students:
- Inadequate Practice: Reading 5-10 ECGs provides basic familiarity; mastery requires reviewing hundreds of tracings. Commit to interpreting 5-10 ECGs daily during clinical rotations.
- Memorization Without Understanding: Simply memorizing criteria without understanding underlying pathophysiology leads to poor retention and difficulty with atypical presentations. Always ask why patterns appear.
- Fear of Being Wrong: Many students avoid ECG interpretation due to fear of making mistakes. Remember that even experienced cardiologists sometimes disagree on interpretation. The key is systematic approach and continuous learning.
- Ignoring Previous ECGs: Comparison with old ECGs often reveals critical changes. Always request and review previous tracings when available.
- Neglecting Clinical Correlation: Never interpret an ECG in isolation. A patient’s symptoms, examination findings, and laboratory results provide essential context.
Preparing for MBBS Exams: ECG Interpretation Tips
ECG questions appear frequently in university examinations, competitive entrance tests, and practical assessments.
High-Yield Topics for Exams
Based on analysis of NEET-PG, USMLE, and various university examination patterns, these ECG topics appear most frequently:
- Normal ECG interpretation (identification of normal sinus rhythm and normal values)
- STEMI localization (anterior, inferior, lateral patterns)
- Common arrhythmias (AF, VT, SVT, heart blocks)
- Bundle branch blocks (LBBB vs RBBB differentiation)
- Electrolyte abnormalities (hyperkalemia, hypokalemia)
- Left ventricular hypertrophy criteria
- Basic measurements (rate, PR interval, QRS duration, QT interval)
Practical Exam Strategy
For practical examinations where you’re shown an ECG and asked to interpret it:
- Step 1 (15 seconds): Quick scan—identify rate (fast/slow), rhythm (regular/irregular), QRS width (narrow/broad).
- Step 2 (30 seconds): Systematic approach—rate, rhythm, axis, intervals.
- Step 3 (15 seconds): Identify key abnormality and state diagnosis.
Sample Answer Format for examiners:
- “This ECG shows a heart rate of approximately 140 bpm”
- “The rhythm is regular with narrow QRS complexes”
- “There are no visible P waves and a fibrillatory baseline is present”
- “This is consistent with atrial fibrillation with fast ventricular response”
- “I would recommend rate control and anticoagulation consideration”
Must-Know ECG Criteria for Exams
Commit these to memory:
- Normal PR interval: 0.12-0.20 seconds
- Normal QRS duration: <0.12 seconds
- STEMI criteria: ≥1mm ST elevation in 2 contiguous leads (≥2mm in V2-V3 for men)
- Sokolov-Lyon LVH criteria: SV1 + RV5/V6 >35mm
- Complete RBBB: QRS ≥120ms + RSR’ in V1-V3
- Complete LBBB: QRS ≥120ms + broad R in V5-V6
- Normal QTc: <0.44s (men), <0.46s (women)
Frequently Asked Questions (FAQs)
Q1: How long does it take to become proficient in ECG interpretation?
A: With dedicated practice, most medical students achieve basic proficiency in 2-3 months. However, true mastery requires years of clinical exposure. Studies show that reviewing 5-10 ECGs daily for 6 months significantly improves accuracy from 45% to 78%. Consistent practice is more important than duration.
Q2: What is the most common mistake beginners make when reading ECGs?
A: The most frequent error is failing to use a systematic approach. Students often jump to pattern recognition, missing critical findings like concurrent AV blocks or electrolyte abnormalities. Always follow the same 10-step method for every ECG, regardless of how obvious one finding appears.
Q3: Can a normal ECG rule out heart disease?
A: No. A normal ECG cannot completely exclude heart disease. Many serious cardiac conditions, including stable coronary artery disease, early cardiomyopathy, and valvular disease, may show normal ECGs at rest. Clinical context, symptoms, and additional testing are essential for comprehensive cardiac assessment.
Q4: How do I differentiate between supraventricular tachycardia (SVT) and ventricular tachycardia (VT)?
A: VT typically shows wide QRS complexes (>120ms), while SVT shows narrow QRS complexes (<120ms) unless aberrant conduction is present. VT often has AV dissociation (P waves independent of QRS), whereas SVT maintains AV relationship. When in doubt, treat wide-complex tachycardia as VT until proven otherwise—it’s safer.
Q5: What are the most critical ECG patterns I must never miss?
A: Life-threatening patterns requiring immediate recognition include: STEMI (ST elevation myocardial infarction), ventricular tachycardia/fibrillation, complete heart block, severe hyperkalemia (peaked T waves, wide QRS), and Brugada pattern (predisposes to sudden cardiac death). These patterns demand immediate intervention.

Q6: How do electrolyte abnormalities affect the ECG?
A: Hyperkalemia causes peaked T waves, widened QRS, and flattened P waves progressively with severity. Hypokalemia produces prominent U waves, flattened T waves, and ST depression. Hypercalcemia shortens the QT interval, while hypocalcemia prolongs it. These changes are clinically significant and require urgent correction.
Q7: What resources are best for learning ECG interpretation?
A: Recommended resources include: “ECG Made Easy” by John Hampton for basics, “The ECG in Practice” for intermediate learning, Garcia and Holtz’s “12-Lead ECG: The Art of Interpretation” for students, and online platforms like Life in the Fast Lane (LITFL), ECG Waves, and Geeky Medics for practice cases. Hands-on practice with real ECGs is irreplaceable.
Q8: How does bundle branch block affect ECG interpretation?
A: Bundle branch blocks widen the QRS complex (≥120ms) and create characteristic patterns. RBBB shows RSR’ (“M-shape”) in V1-V3, while LBBB shows broad R waves in V5-V6. Importantly, LBBB can mask myocardial infarction on ECG, requiring modified Sgarbossa criteria for STEMI diagnosis. Both patterns can be normal findings or indicate underlying cardiac disease.
Q9: What is the significance of reciprocal changes in STEMI?
A: Reciprocal changes (ST depression in leads opposite to ST elevation) increase diagnostic confidence for STEMI and help distinguish true infarction from other causes of ST elevation like pericarditis. For example, inferior STEMI (ST elevation in II, III, aVF) typically shows reciprocal ST depression in I and aVL.
Q10: How can I improve my ECG interpretation speed for emergency situations?
A: Focus on rapid initial assessment: rate (fast/slow/normal), rhythm (regular/irregular), QRS width (narrow/wide), and obvious ST changes. This takes 15-30 seconds and identifies life-threatening conditions. Then perform systematic full interpretation. Practice with timed ECG quizzes to build speed without sacrificing accuracy.
Exam Question–Answer Section (University Pattern)
Question 1 (10 Marks)
Stem: A 58-year-old man with diabetes presents to the emergency department with severe chest pain radiating to the left arm for the past 45 minutes. His ECG is performed.
Sub-questions:
a) List the systematic approach to ECG interpretation (5 marks)
b) What are the ECG criteria for diagnosing STEMI? (3 marks)
c) Name the leads that suggest inferior wall myocardial infarction (2 marks)
Model Answer:
a) Systematic Approach (5 marks):
- Verify patient details and ECG quality (0.5 mark)
- Calculate heart rate—normal 60-100 bpm (0.5 mark)
- Assess rhythm—regular vs irregular, P wave presence (0.5 mark)
- Determine cardiac axis (0.5 mark)
- Measure PR interval—normal 0.12-0.20 seconds (0.5 mark)
- Analyze QRS complex—duration and morphology (0.5 mark)
- Evaluate ST segments—elevation or depression (1 mark)
- Review T waves (0.5 mark)
- Calculate QT interval (0.5 mark)
- Identify additional findings (0.5 mark)
b) STEMI ECG Criteria (3 marks):
- ST elevation ≥1mm in two contiguous limb leads (1 mark)
- OR ST elevation in precordial leads: ≥2.5mm (men <40 years), ≥2mm (men ≥40 years), ≥1.5mm (women) in V2-V3 (1 mark)
- Reciprocal ST depression may be present (0.5 mark)
- May progress to T wave inversion and pathological Q waves (0.5 mark)
c) Inferior Wall MI Leads (2 marks):
- Lead II (0.5 mark)
- Lead III (0.5 mark)
- Lead aVF (0.5 mark)
- Usually indicates Right Coronary Artery occlusion (0.5 mark)
Question 2 (5 Marks)
Stem: Define the following ECG terms and state their normal values:
a) PR interval
b) QRS duration
c) QTc interval
d) Normal cardiac axis
e) Normal heart rate
Model Answer:
- a) PR interval: Time from start of P wave to start of QRS complex; Normal = 0.12-0.20 seconds (3-5 small squares) (1 mark)
- b) QRS duration: Time for ventricular depolarization; Normal = <0.12 seconds (<3 small squares) (1 mark)
- c) QTc interval: Corrected QT interval accounting for heart rate; Normal = <0.44s (men), <0.46s (women) (1 mark)
- d) Normal cardiac axis: Overall direction of ventricular depolarization; Normal = -30° to +90° (1 mark)
- e) Normal heart rate: 60-100 beats per minute in adults at rest (1 mark)
Question 3 (8 Marks)
Stem: A 68-year-old woman on hemodialysis presents with weakness. Her ECG shows tall, peaked T waves and widened QRS complexes.
a) What is the most likely diagnosis? (2 marks)
b) List the progressive ECG changes seen with worsening of this condition (4 marks)
c) Name two immediate treatments (2 marks)
Model Answer:
a) Diagnosis (2 marks):
- Hyperkalemia (severe) (1 mark)
- Secondary to renal failure/missed dialysis (1 mark)
b) Progressive ECG Changes (4 marks):
- Mild (5.5-6.5 mEq/L): Tall, peaked T waves with narrow base (1 mark)
- Moderate (6.5-7.5 mEq/L): Prolonged PR interval, flattened P waves (1 mark)
- Severe (>7.5 mEq/L): Widened QRS complex (1 mark)
- Critical (>8.0 mEq/L): Sine wave pattern, risk of ventricular fibrillation and cardiac arrest (1 mark)
c) Immediate Treatments (2 marks):
- IV Calcium gluconate or calcium chloride—stabilizes cardiac membrane (1 mark)
- Insulin with dextrose—shifts potassium into cells (0.5 mark)
- Emergency hemodialysis (0.5 mark)
Quick Diagram Prompt: “Draw tall, narrow, peaked T waves progressing to widened QRS with eventual sine wave pattern demonstrating hyperkalemia progression”
Viva Tips:
- Always correlate ECG with clinical context (renal failure patient)
- Remember “cardiac membrane stabilization” comes before “potassium shift”
- Be ready to discuss other causes: medications (ACE inhibitors, potassium-sparing diuretics), rhabdomyolysis
- Last-Minute Checklist:
✓ Normal potassium: 3.5-5.0 mEq/L
✓ Peaked T waves = hyperkalemia
✓ Prominent U waves = hypokalemia
✓ Calcium stabilizes, insulin shifts, dialysis removes
Conclusion: Your Roadmap to ECG Mastery
Mastering ECG interpretation: stepwise guide for undergraduates represents a journey, not a destination. The systematic 10-step approach outlined in this guide provides the foundation you need to confidently interpret ECGs in clinical practice, excel in examinations, and most importantly, deliver superior patient care.
Key Takeaways:
- ✓ Always use a systematic approach—consistency prevents missed findings and builds expertise over time
- ✓ Understand the pathophysiology—knowing why patterns appear enhances retention and enables interpretation of atypical presentations
- ✓ Practice regularly—reviewing 5-10 ECGs daily dramatically improves accuracy within months
- ✓ Learn to recognize life-threatening patterns—STEMI, VT/VF, complete heart block, and severe electrolyte abnormalities demand immediate recognition
- ✓ Correlate with clinical context—never interpret an ECG in isolation from patient symptoms and examination findings
- ✓ Embrace mistakes as learning opportunities—even experienced cardiologists disagree sometimes; systematic approach minimizes errors
Your Action Plan:
This Week: Review 10 normal ECGs to establish baseline pattern recognition. Focus on identifying normal P waves, PR intervals, QRS complexes, ST segments, and T waves.
This Month: Interpret 5-10 ECGs daily using the systematic approach. Start with simple abnormalities (sinus tachycardia, bradycardia, first-degree AV block) and gradually progress to complex patterns.
Next Three Months: Join ECG interpretation sessions, participate in collaborative learning, and regularly test yourself with online ECG quizzes. Aim for 100+ ECG interpretations.
Long-Term: Make ECG interpretation a daily habit during clinical rotations. Review interesting cases with seniors, attend ECG workshops, and continuously challenge yourself with difficult tracings.
Remember, every expert cardiologist once struggled with their first ECG. The difference between competence and mastery lies in consistent, deliberate practice and a systematic approach. Your journey to ECG interpretation excellence starts today.
Ready to expand your medical knowledge? Subscribe to the Simply MBBS newsletter for weekly evidence-based articles on medicine, physical health, mental health, and MBBS exam preparation. Join thousands of medical students and doctors worldwide who trust Simply MBBS for clear, comprehensive medical education. Visit simplymbbs.com to access more quick guides, FAQs, and exam-style notes designed specifically for learners like you.
Share your ECG learning journey with fellow medical students—because collaborative learning accelerates mastery. Leave a comment below about your biggest ECG interpretation challenge, and let’s solve it together!